When it comes to technical analysis, it’s all about confirmation of support and resistance.
If we fail to identify either, we take on far too much risk. We may buy – or even sell at the wrong time. And as many of us know, it can be costly – and frustrating.
So, the more you know, the better off you are.
One way to identify key lines of the two is by paying attention to Fibonacci Retracement levels.
Retracement levels are based on the belief that stocks, currencies and indices tend to retrace their paths after a big move in a single direction. You first find your two extremes – a peak and a trough – and divide by key Fibonacci ratios, such as 23.6%, 38.2%, 50%, 61.8%, and 76.4%.
All are used to forecast the technical potential pullbacks or moves higher.
Once those levels are clearly identified, we then draw our horizontal lines at each % marker to define points of support and resistance. For reasons that are still not clear to all traders, these ratios play a big role in the market to determine critical points.
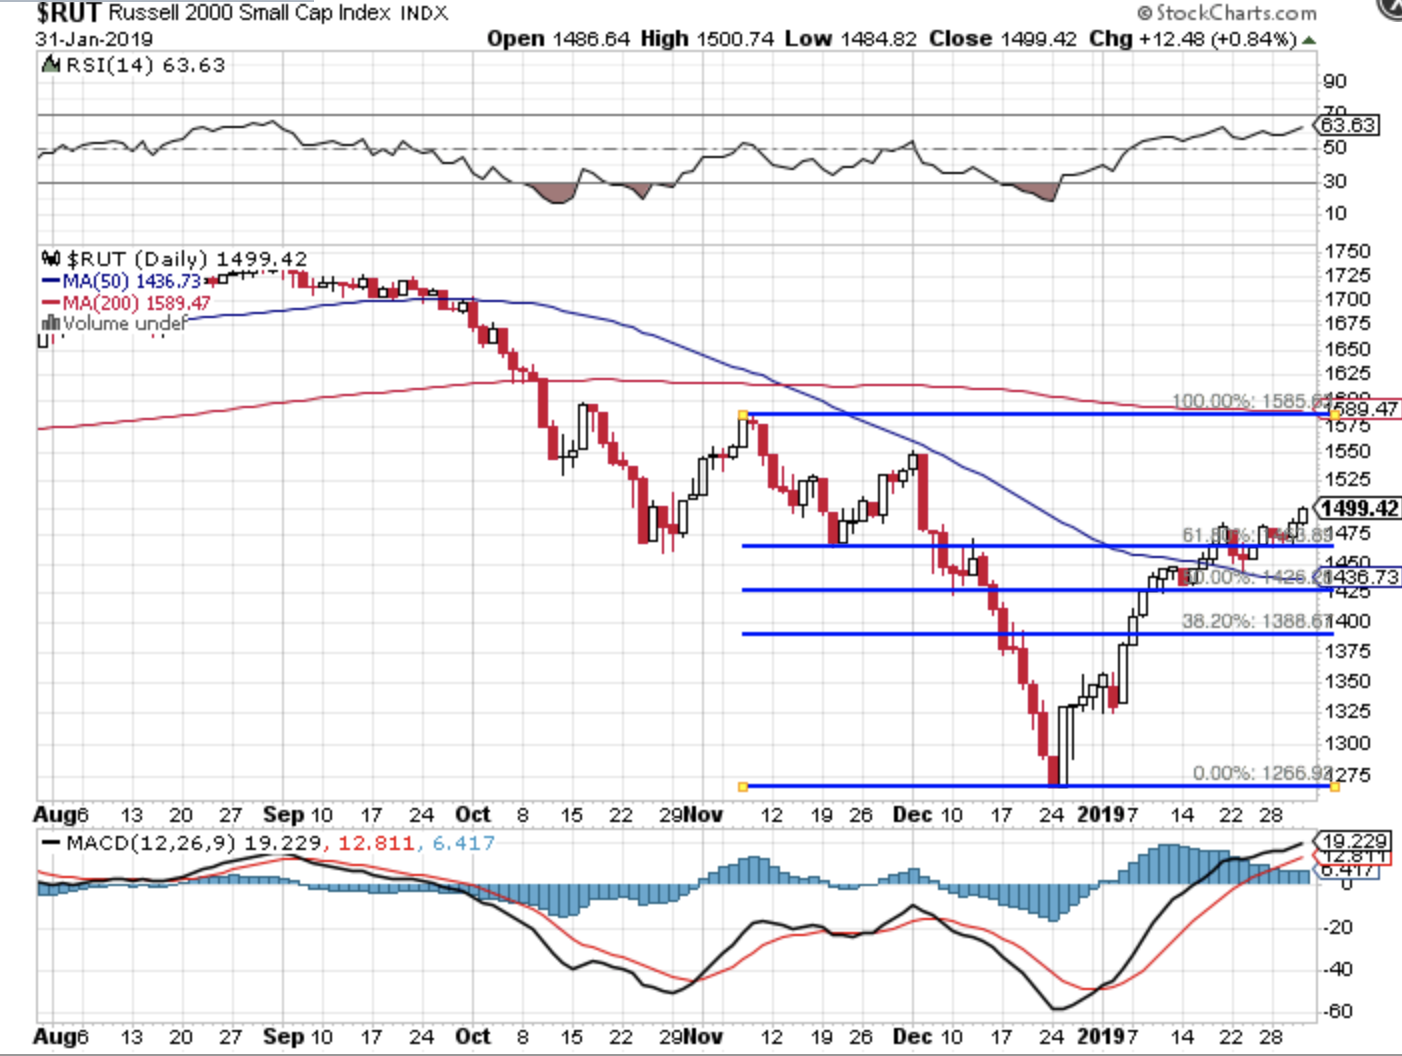
Look at the Russell 2000 small cap index (RUT), for example.
After drawing our lines, we can see that Fibonacci Retracement Levels pinpoint key levels of support and resistance to watch. For example, the 61.8% line served as support in mid-November 2018. We can see that in December 2018, the RUT caught temporary support at the 50% retracement line, as it did again at the start of January 2019.
In short, this is a technical indicator that may serve you well as it highlights support and resistance. Of course, you never just want to rely on Fibonacci Retracement Levels.
Relying on just one indicator without confirmation can also be costly and frustrating, too. Personally, not only will I watch key lines of support and resistance, but I’ll confirm with other indicators such as Williams’ %R (W%R), MACD, relative strength (RSI), and Bollinger Bands.