One of the best ways to track volatility in the markets is with the Volatility Index (VIX).
Otherwise known as the fear gauge, it’s a measure of expected price fluctuations in the S&P 500 over the next 30 days. As it begins to rise, it tells us fear is beginning to escalate, and that we may want to consider selling our stocks, or shorting the markets.
Aside from the VIX, we can also use the RVX, or the Volatility Index of the Russell 2000.

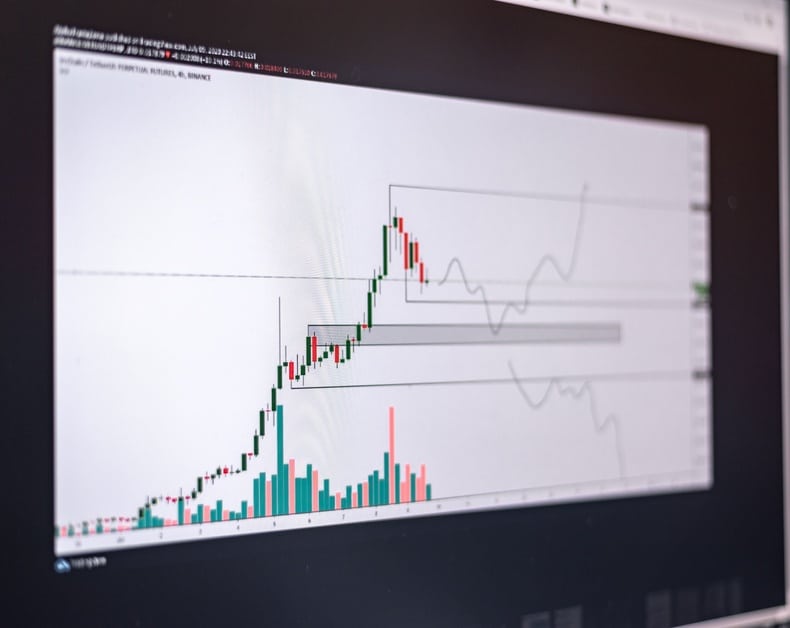
At the moment, the RVX is sitting at 19 after pulling back from 36. However, it’s beginning to again turn higher as tensions in the market begin to rise. At the same time, the Russell 2000 is beginning to top out at double top resistance, and is beginning to turn lower.
Both are an indication we may want to consider shorting the Russell 2000 at this time.
Why are Tensions Rising in the Markets Again?
Over the last month, markets pushed higher on hopes for a trade war resolution. That was until Larry Kudlow told Fox Business, “The president has indicated that he’s optimistic with respect to a potential trade deal. But we’ve got a pretty sizable distance to go here.”
With those three untimely words, “pretty sizable distance” markets are beginning to fall apart.
Remember, if China and the U.S. cannot reach a deal by the start of March 2019, additional tariffs on Chinese goods will take effect. That’s likely to include tariffs on $200 billion on Chinese goods to 25% from 10%. Should that happen, we could run into further global economic slowdown fears, and further market downside.
Then, President Trump said he would not meet with Chinese President Xi Jingping before the March 2019 deadline adding to the volatility.
In short, if there’s no progress, markets could begin to pull back severely.
It’s why the VIX and the RVX are beginning to tick higher. It’s just something to be well aware of if you’re considering going long in the market.